The development of apprentice wages and the impact of the new apprentice rate of the National Minimum Wage
1 Sep 2013
Stefan Speckesser, Principal Economist
 Please note, this online version of this article supersedes the printed version, due to an error printed on p7, where a graph was ommitted.
Background
Pay for apprentices in the first year of their apprenticeship, or generally for apprentices under the age of 19, had been exempt from the UK’s National Minimum Wage (NMW) regulation when this was first introduced in 1999. This exemption remained in place when a NMW was introduced for 16-17 year olds in 2004. While some recommendations for minimum weekly earnings levels for apprentices existed in England, a single hourly rate regulated within the NMW framework was only introduced on 1 October 2010. The introduction of this rate marked an important regulatory change on apprentice pay as it specified what counts as minimum wage and provided clear guidance on the treatment of benefits-in-kind and of hours of work which must be paid. In addition, the NMW compliance and enforcement regime was extended to cover apprentices.
IES was commissioned by the Low Pay Commission to estimate the impact of the introduction of the apprentice rate on wage levels with descriptive methods and by carrying out an econometric impact assessment[1]. We used large-scale data from two apprentice pay surveys of the time before and after the introduction of the apprentice rate, provided by the Department for Business, Innovation and Skills, and further individual-level data from the Labour Force Survey.
Changes in apprenticeship wages
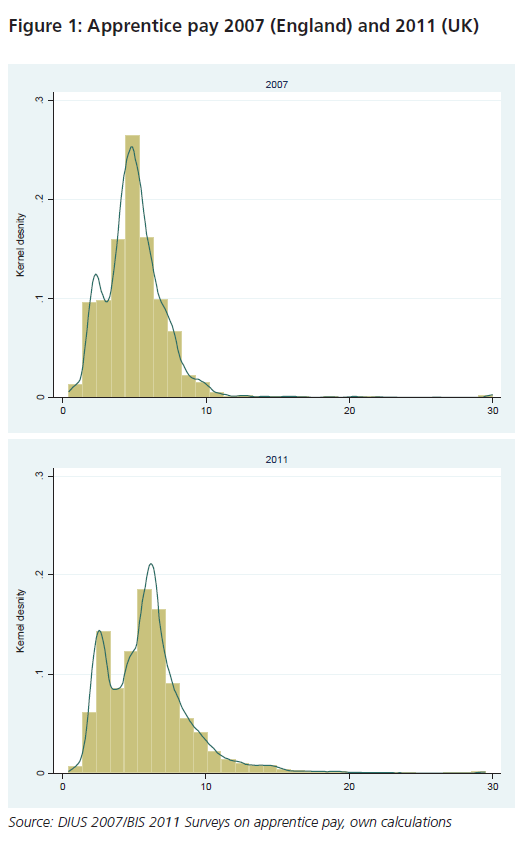
Our descriptive analysis compares the distribution of hourly gross wages of apprentices in 2007 and 2011 using histograms (Figure 1), which show the size of groups reported in the surveys, with hourly wages in intervals between a minimum of £0-£1 and a maximum of £29 and over. In addition, we show kernel density estimates of the wage distribution as a blue curve. Compared to the discrete nature of the histogram, the aggregated kernel density estimates smooth out the contribution of each observed wage relative to other data points[2] and converge faster to the true density for continuous variables such as wages.
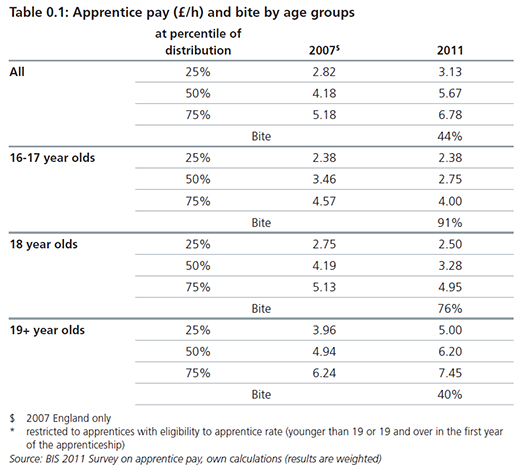
The results show some interesting changes in the wage distribution: while median hourly wages of apprentices in England increased from £4.18 (2007) to £5.87 (2011), the distribution has become increasingly bimodal and shows that relatively more people were earning the wages close to the apprentice rate of the NMW of £2.50. However, the longer right side tail also points to many apprentices earning higher wages, particularly in 2011. The distribution widened between 2007 and 2011 and skewness increased, which suggests that there was considerable growth of high earnings until 2011.


These changes in the distribution of apprentice wages originate primarily from the increase in mature apprenticeships in England. While apprenticeships started by 16-18 year olds grew moderately by about 22,000 between the academic years 2007/08 and 2010/11, apprenticeships started by those older than 25 increased from 27,200 to 229,300 and their share of all apprentices increased from 12 to 44 per cent.[3] As mature apprentices have more work experience, wages for this group tend to be higher when undertaking apprenticeships than for young people, which affects the observed distribution.
This is confirmed when describing the distribution by age groups:
- For the youngest, the lower quartile stagnated, while wages fell at median and upper quartile. The median wage of £2.75 for 16-18 year olds is close to the NMW apprentice rate of £2.50, and the lower quartile of £2.38 is below. The ratio of the hourly statutory pay of £2.50 as percentage of median earnings, known as the bite of the minimum wage, is very high (91 per cent).
- Apprentice wages also decreased for 18 year olds, although levels are higher at the different points of the distribution.
- By contrast, hourly wages increased for apprentices aged 19+ at all points of the distribution.
The impact of the introduction of the apprentice rate of the NMW We estimated the impact of introducing the apprentice rate on hourly apprentice wages using a difference-in-differences estimator, which subtracted the mean difference in observed wages between apprentices affected by the introduction of the apprentice rate and a control group[4] prior to its introduction in 2007 from the differences between both groups after the introduction in 2010. Implemented in linear regression models, we additionally controlled for demographic variables and sector/framework and estimated impacts separately for young and mature apprentices.
Our findings show that mature apprentices (aged 25+) were not affected by the introduction of the apprentice rate. By contrast, we found a negative impact of introducing the rate on wages of young apprentices. This finding is surprising because the introduction of a minimum wage should unambiguously increase average wages as those below the level would have to be lifted. However, it is not impossible in a situation of generally decreasing apprentice wages: introducing the minimum wage could have prevented apprenticeship wages from decreasing even further. Nonetheless, an estimated impact could be negative without controlling for such specific trends in apprentice wages, which was not possible because data was only available for 2007 and 2011.
Impact in sectors with low apprenticeship wages
In our view, our research points towards the great methodological difficulty of estimating the average impact of introducing the minimum wage with available data and evaluation methods because apprenticeships are expanding and transforming at the same time. Although our econometric models capture sector effects with dummy variables, they cannot fully control for compositional changes in apprenticeships, in particular the growth of apprentices in non-traditional sectors such as retail, heath and childcare, which had further impacts on average wages in addition to the introduction of the rate. Therefore, we estimated further impacts at sector level. These show insignificant impacts of the introduction of the rate for most sectors, but also a positive impact increasing the wages of hairdressing apprentices younger than 25. This is some evidence that the introduction of the rate increased apprentice wages where they are traditionally very low, which should be further investigated.
Footnotes [back]
[1] Speckesser S and Behling F (2013). An impact analysis of the introduction of the Apprentice Rate of the National Minimum Wage: A research paper to the Low Pay Commission for the preparation of its 2013 report. Online link (August 2013): http://www.lowpay.gov.uk/lowpay/research/pdf/Final_Report_IES_ref_00101_2890.pdf
[2] This depends on the distance between point x(i) and x subject to a kernel function (we assume a normal kernel on each of the data points) and a bandwidth parameter. The estimated density at any point x is

with kernel function K and bandwidth h. Estimated f(x) integrate to one and depend both on bandwidth and shape of the kernel function. While the latter is less, the choice of the bandwidth clearly matters as a too low bandwidth would result in very spiky kernel densities.
[3] Data Service (2013) Apprenticeship Statistics, Online link (August 2013): http://www.thedataservice.org.uk/Statistics/fe_data_library/Apprenticeships/
[4] Control groups were obtained from the Labour Force Survey microdata (employed people aiming to achieve similar vocational qualifications outside apprenticeship contracts) and the apprentice pay surveys (apprentices earning above the apprentice rate).


