IES at 50: half a century in Brighton & Hove, our local labour market
21 Dec 2018
Matthew Williams, Senior Research Fellow and Tony Wilson, Institute Director
In the last of our #ies50 blogs, we’ve decided to look back at how our home city (or as it was then, twin towns) has changed in the fifty years since we were founded. We’ve been based here for the duration of our 50-year existence – first on the campus of the University of Sussex, then, in more recent years, we moved into Brighton, and now just into Hove (actually).
Like most of the local labour markets in which we conduct analysis, the composition of Brighton and Hove’s workforce has changed considerably during these 50 years.
So, where have we seen the greatest change, and what might these changes mean for the future success of the city’s economy?
The earliest we can gaze back through the crystal ball of available published statistics is to the 1971 Census of Population, which gives us a near-50 year timeframe to the present day in which to investigate key trends.
More people are in work or are looking for work
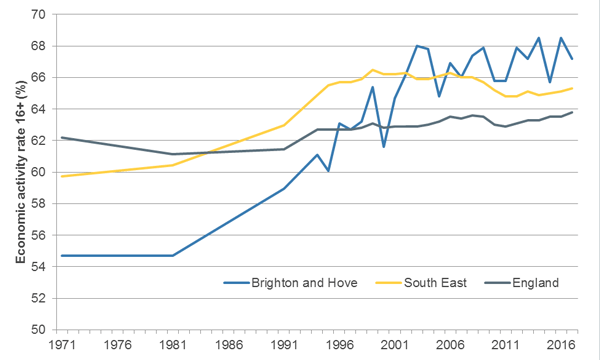
Back in 1971, just over half (55%) of Brighton and Hove residents aged 16 and over were economically active – so either in work or actively seeking work. This was lower than the proportions in the South East of 60 per cent and in England of 62 per cent. To some extent, this reflected the older-than-average age profile, particularly in Hove where the activity rate was only 49 per cent.
However, during the 1980s and 1990s the activity rate increased rapidly, overtaking the rate in England in the second half of the 1990s, and the rate in the South East in the early part of the 2000s, and has fluctuated around 67 per cent since then. This partly reflects a growing local economy but also, again, changes in the age structure. While England overall has got older, our city has got younger and younger – with the proportion of the population of Brighton and Hove aged 65 and older nearly halving since 1981 (from 23% to 13%), while for England overall, it has risen (from 15% to 18%).
Figure 1 Economic activity rate, 16+ population, 1971-2017
Source: Census of Population 1971, 1981, 1991; Labour Force Survey/Annual Population Survey 1994-2017
People travel more, and further, for work
Back in 1971, around one in five employed residents (19%) travelled outside of Brighton and Hove to work, while one in four jobs (24%) in Brighton and Hove were filled by non-residents. Four decades later, the number of residents travelling to work outside of the city had increased to one in three (33%). This large increase mirrors national trends over this time, with increased car ownership and more frequent and quicker public transport (although for those using Southern or Thameslink trains, it has not always felt like it).
Interestingly, the proportion of jobs in Brighton and Hove filled by non-residents has also risen over these years, but not by as much – from 24 to 30 per cent. This is despite rapid increases in house prices in Brighton and Hove relative to other local areas.
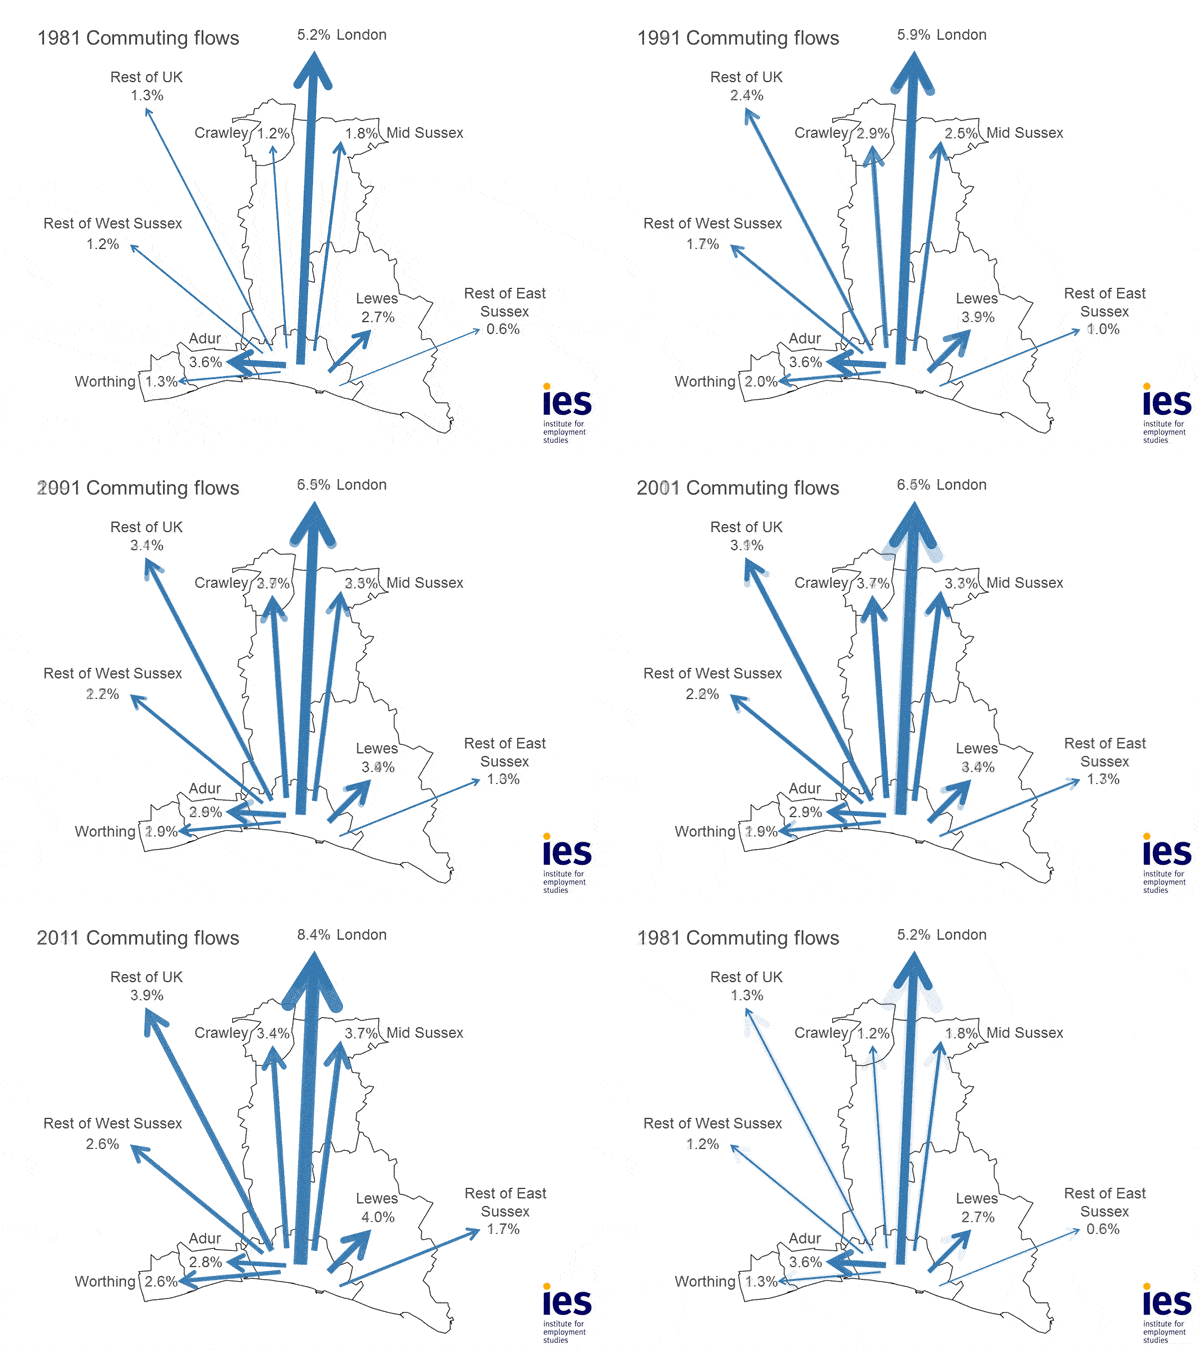
Commuting to London has been a daily routine for many Brighton and Hove residents, but again this has increased in the last four decades – from one in twenty working residents in 1971 to one in twelve by 2011. Local commuting has also increased; in 1971, three per cent of residents commuted to East Sussex and nine per cent to West Sussex, and these proportions have more or less doubled to six per cent and 15 per cent respectively by 2011. Lewes has always been the main employment destination in East Sussex, while in West Sussex, Adur has been replaced by Crawley and Mid Sussex as the main destinations for those commuting out of Brighton and Hove.
Figure 2 Out-commuting flows as a proportion of all Brighton and Hove employed residents, 1981-2011
Source: Census of Population 1981, 1991, 2001, 2011
The vast majority of those commuting into Brighton and Hove have always come from East and West Sussex, and Lewes and Adur districts in particular.
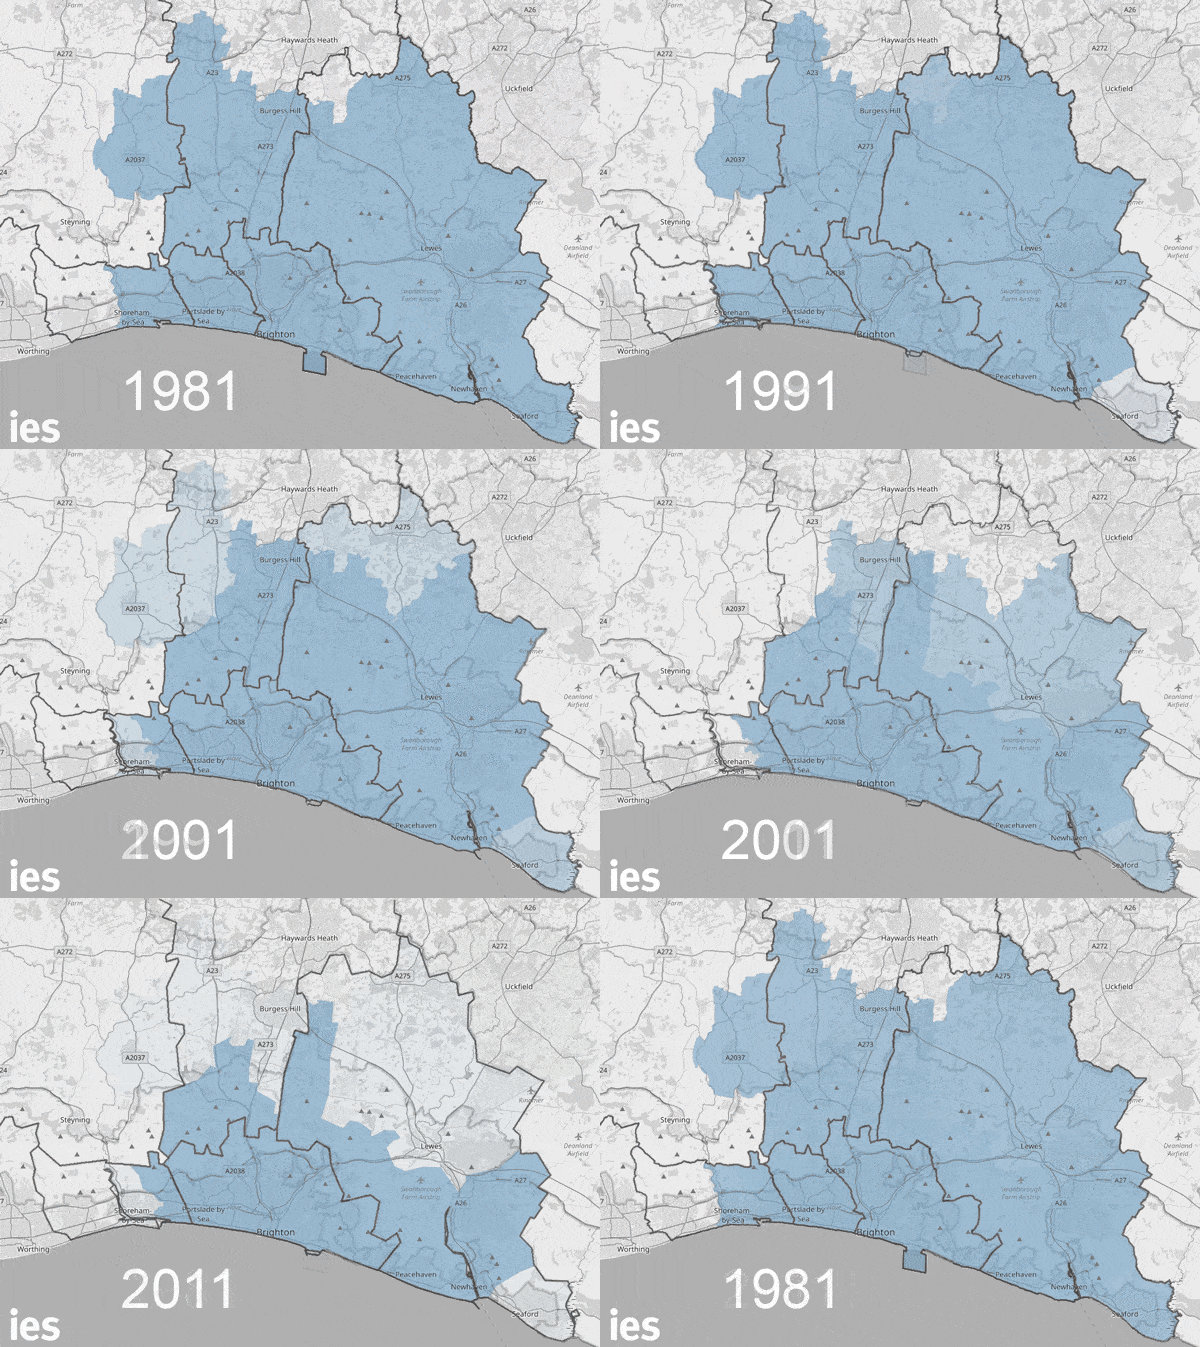
One interesting way to look at these trends is by looking at changes to the Brighton Travel to Work Area (TTWA). This is defined as the area around the city in which at least two-thirds of workers live, and in which at least two-thirds of employed residents work – so an approximation to the city’s functional labour market. As these proportions change, so does the TTWA.
As the animation below shows, this area has been shrinking over the last few decades – as local areas to the north of the city have become more linked with the Crawley/Gatwick labour market and, most recently, as Lewes has joined the Eastbourne labour market (Seaford does the hokey-cokey – in one decade, then out the next). So even as more Brighton and Hove residents travel outside the TTWA, particularly to London, the TTWA itself has shrunk.
Figure 3 Brighton Travel to Work Area, 1981-2011
Source: Census of Population 1981, 1991, 2001, 2011; OpenStreetMap
More than ever, Brighton and Hove is a service sector economy
The industrial structure[1] of the Brighton and Hove labour market in 1971 was also very different to the current structure.
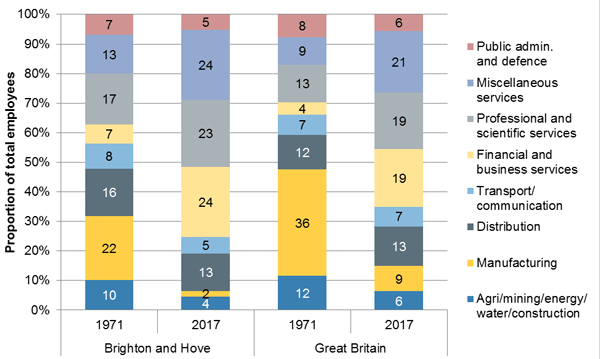
In 1971, one in five Brighton and Hove residents (22%) worked in manufacturing sectors, a substantial proportion of the labour force but below the national proportion of 36 per cent. The city had a healthy electrical engineering sector, which accounted for 5.6 per cent of all employees, above the national proportion of 3.7 per cent, and a sizeable mechanical engineering sector (4.6%, compared with 5.1% nationally). However, by 2017 the manufacturing sector in Brighton and Hove had all but disappeared, shrinking to just two per cent of total employment, compared with just under nine per cent nationally.
Brighton and Hove has always been dominated by service sector jobs – with two thirds (68%) of employees working in services in 1971, compared with 52 per cent nationally. Even in the 1960s and 1970s, these jobs were not dominated by tourism and leisure. Professional and scientific services (including education and health) accounted for 17 per cent of jobs, closely followed by distributive trades (16%) and miscellaneous services (13%, which includes hotels and restaurants). Financial and business services accounted for 6.5 per cent of all employees. By 2017, the proportion of employees in services had risen to a staggering 94 per cent, above the England figure of 85 per cent.
Figure 4 Employees in employment by sector, Brighton and Hove, 1971-2017
Source: Census of Population 1971; Business Register and Employment Survey 2017
This growth has been driven by often highly-skilled work. Financial services being a major growth area, as the likes of American Express and Legal and General have established substantial operations. These now account for seven per cent of all employees compared with 3.5% nationally. Other over-represented sectors in the city include in software and IT, creative and performing arts, higher education (the Universities of Sussex and Brighton), local government and regulatory bodies (including The Pensions Regulator), utilities (electricity and water) and tourism.
The rise of the managers and professionals
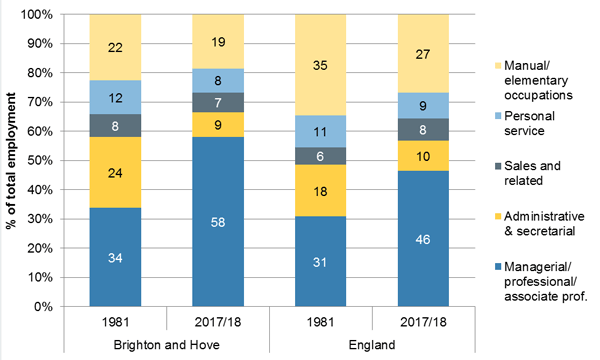
These changes have also been reflected in the changing occupational profile of workers in Brighton and Hove. Back in 1981, one in three workers were in high-level non-manual occupations (managerial, professional and associate professional/technical occupations) while one in four were in administrative and secretarial roles and a slightly lower proportion (22%) in in manual and elementary jobs. Brighton and Hove was marginally more managerial and professional, but a lot less manual, than England overall.
By 2017-18, the proportion of workers in high-level, non-manual occupations had risen significantly, to nearly two in three (58%) – far more than the 46% for England. Meanwhile the proportion of administrative and secretarial workers had more than halved to one in ten. Interestingly, manual and elementary work has remained broadly stable even as manufacturing has collapsed – reflecting a shift towards elementary service sector jobs replacing the lost unskilled manual jobs.
Figure 5 Employment by occupation, Brighton and Hove, 1981-2017/18
Source: Census of Population 198; Annual Population Survey 2017/18
We have enjoyed two booms and weathered three busts
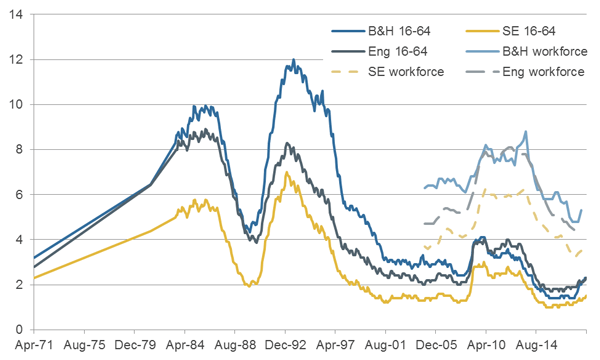
In 1971, the unemployment rate in Brighton and Hove stood at 3.2 per cent of the total working-age population, slightly higher than the current proportion of 2.3 per cent.
However, the rate has been on a roller-coaster ride over the last five decades, peaking at 10 per cent in the early 1980s and then at 12 per cent in the early 1990s following two big recessions. Our city was particularly affected by the latter recession, reflecting its exposure to skilled service industries and financial services in particular. It also recovered more slowly, only reverting to its pre-recession path in the early 2000s – as the ‘NICE’ decade began and active labour market policies ramped up.
Interestingly, the ‘Great’ Recession in 2008-09 saw the smallest rises in unemployment – peaking at four per cent in Brighton and Hove – with the impacts of the recession being felt far more in hours and pay than in levels of employment.
Unemployment has always been higher in Brighton and Hove than in the South East region, and for most of the last four decades has been higher than in England overall – although since the most recent downturn, the gap between the city and England has disappeared. This is true both on the unemployed per working-age population rate, and on the real unemployment rate – which measures the unemployed as a proportion of only those who are economically active (data from 2004 onwards).
Figure 6 Unemployed as a proportion of 16-64 population, 1971-2018, and unemployment rate 2004-2018
Source: Census of Population 1971 and 1981; Claimant Count; APS model-based estimates of unemployment
Where next for Brighton and Hove?
So, the last fifty years has seen our city become younger, more professional and more service-based, with more people working and fewer unemployed. Finance, creative design and IT, among other things, have replaced the manufacturing jobs lost over the past few decades. Although tourism is still an important contributor to the local economy, the city’s image is more ‘silicon beach’ and hipsters.
Looking ahead, the future looks bright with employment projected to grow at a fast rate. At the same time though, the big shifts in working patterns, industries and occupations in recent decades reiterate the need for national and local partners to support local growth, flexible and active labour market policies, and skills training and investment. The workforce of the 2030s and 2040s will, for the most part, be the same people as are in work now – just older, wiser and often in different jobs. There will be more peaks and troughs along the way – Brexit will be one – but, at IES, we’re looking forward to working with our city and many others to prepare and respond to them.
[1] Industrial classifications have changed over time, but we have regrouped industries to be comparable with the major groups used in 1971 to get a consistent time series; professional and scientific services includes education and health; miscellaneous services includes hotels, restaurants, pubs and clubs.
Any views expressed are those of the author and not necessarily those of the Institute as a whole.


