Labour Market Statistics, July 2025
17 Jul 2025
 Seemanti Ghosh, Principal Research Fellow (Economist)
This briefing sets out analysis of the Labour Market Statistics published this morning. Today’s LFS data covers the period from March to May 2025. While we discuss the numbers released today, we also briefly review this data in the context of recent economic environment and share our thoughts about the future.
The unemployment rate has increased further and is now at its highest rate in four years. The employment and inactivity rate have both modestly improved on the quarter for the 16 to 64 years age group but remains worse than pre-pandemic levels. This indicates that while more people are joining the workforce, finding work is becoming increasingly difficult.
Employment: The UK employment rate for people aged 16 and over was estimated at 60.8% in March to May 2025. That is 750,000 more people than a year ago and 134,000 more people than the last quarter. This translates to an increase in the employment rate of 0.7% on year and 0.1% on quarter. The UK employment rate for people within the 16 to 64 age group was estimated at 75.2% in March to May 2025. The ONS recommends caution when interpreting recent comparisons of Labour Force Survey (LFS) estimates, due to ongoing methodological changes.
Unemployment: The UK unemployment rate for people aged 16 and over was estimated at 4.7% in March to May 2025. That is 124,000 more people than a year ago and 98,000 more people than the last quarter. This translates to an increase in the unemployment rate of 0.2% both on year and on the quarter. The UK unemployment rate for people within the 16 to 64 age group was estimated at 4.7% in March to May 2025.
Inactivity: The UK inactivity rate for people aged 16 and over was estimated at 36.3% in March to May 2025. That is 277,000 less people than a year ago and 86,000 less people than the last quarter. This translates to a decrease in the inactivity rate of 0.9% on year and 0.2% on the quarter. The UK inactivity rate for people within the 16 to 64 age group was estimated at 21% in March to May 2025.
Figure 1: Employment, unemployment and economic inactivity rates (%)
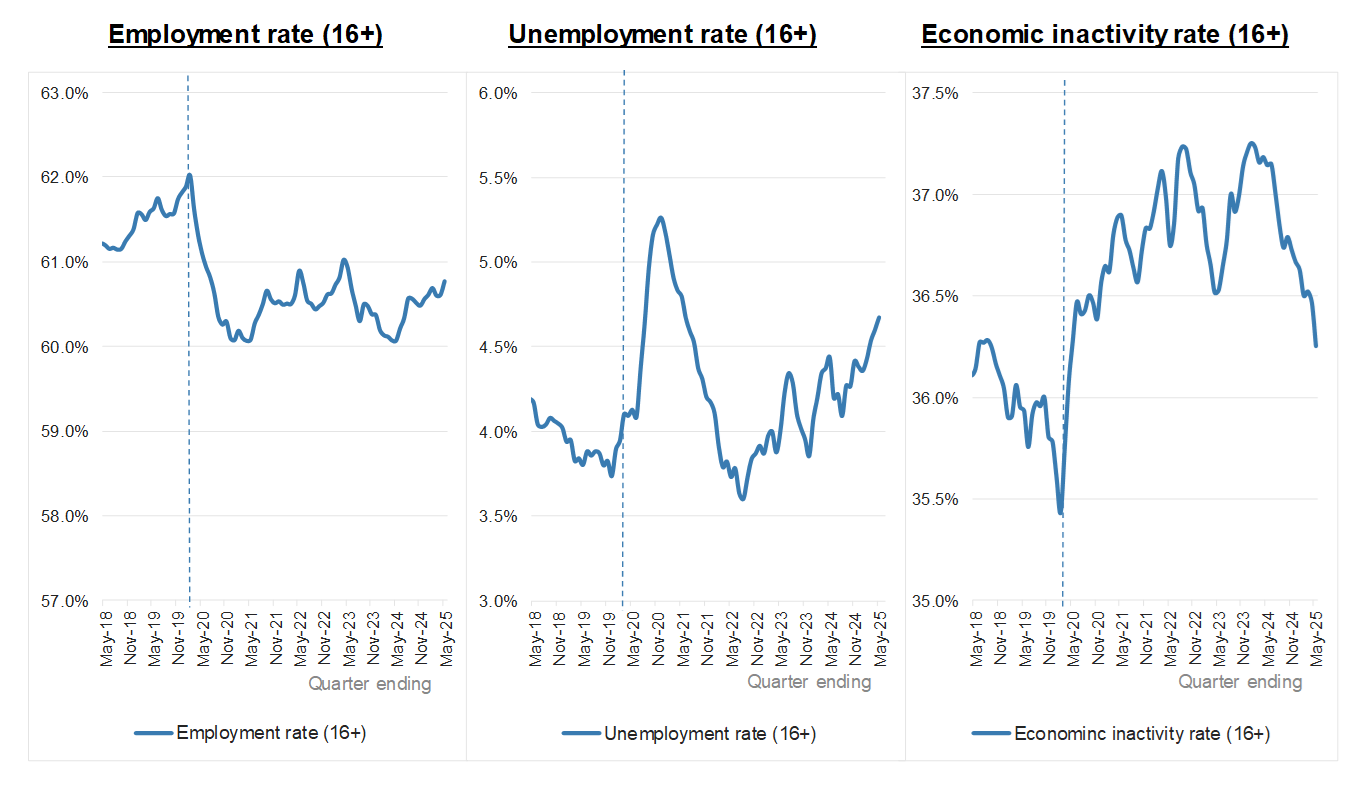
Source: Labour Force Survey. Vertical dotted line indicates start of first Covid-19 lockdown.
Vacancies and payrolled employees continue to fall
Today’s labour market data shows that the number of vacancies fell for the 36th consecutive quarter, and with a decline observed across 14 out of the 18 industry sectors. There is a notable decrease in the number of vacancies in the service sector over one year (121,000) and over last quarter (38,000). In terms of the percentage of vacancies, construction has witnessed the largest percentage change on quarter (32%), followed by motor trades (20%), and retail (14%). Overall, the estimated number of UK vacancies was 727,000 between April to June 2025, indicating a decrease of 56,000 (approx. 7%) on the quarter and 143,000 (approx.17%) on the year.
The total number of payroll employees has decreased by 75,000 (0.2%) between February and May 2025 and by 134,000 (0.4%) on the year. The provisional estimate of payrolled employees for June 2025 decreased by 90,000 on quarter and 178,000 on year, however these numbers will be verified next month. Payrolled employees have decreased in 12 out of 20 sectors over last quarter, with the highest quarterly decrease observed in Accommodation and Food Services (32,000), followed by Professional, Scientific and Technical (16,000), and Construction (15,000). The provisional estimates for June suggest that Professional, Scientific and Technical is almost catching up with Accommodation and Food Services, therefore indicating an increasing rate of decline in jobs in this sector. The sector that has witnessed a notable increase in number of payrolled employees over last quarter is Health and Social Work (15,000).
Pay growth is accelerating but lower than a year ago
Both regular pay (excluding bonuses and arrears) and total pay appear to be rising but at a slower rate than last quarter and a year ago. The gap is widening between private and public sector, with private sector trailing behind. Annual growth in employees' average regular earnings in Great Britain for both regular earnings (excluding bonuses) and total earnings (including bonuses) was 5.0%. Growth in regular pay in public sector is higher (5.5%) compared to the private sector (4.9%) for March to May 2025. Overall, regular pay growth is 0.8% lower than a year ago. Annual growth in real terms, adjusted for inflation using CPIH, was 1.1% for regular pay in March to May 2025.
Today’s figures suggest possible weakening in employer confidence following the rise in National Insurance contributions and the National Living Wage. However, the cooling labour market is also an indicator of ongoing economic uncertainty. The labour market has significantly reduced in size with a net loss of 178,000 jobs over past year, in stark contrast to the previous year when there was a gain of 260,000 jobs. Declining vacancies and payroll numbers in services, construction and retail - all labour-intensive sectors – are significantly contributing towards the declining workforce trend and clearly indicates employer hesitancy. Declines in the professional services sector may have been driven by a combination of ongoing economic uncertainty, anticipated reduction in investment in R&D and the impacts of Artificial Intelligence, alongside rising employer costs.
Overall, the combined figures suggest a cooling labour market in the UK where employers are clearly hesitant to invest in workforce expansion, with most sectors reducing their workforce size. We will have to wait to see if the recently announced boost in £100 billion capital expenditure by Rachael Reeves boosts the expansion of some of sectors such as construction. With the industrial strategy now having been finalised, the government needs to move swiftly to implement its plans in order to boost business confidence and workforce expansion.
| Category | Blog posts |
|---|---|
| IES contact |
 Meghna Sharma Meghna Sharma
 Seemanti Ghosh Seemanti Ghosh
|
